

By Lee Rivers, Biotech Analyst
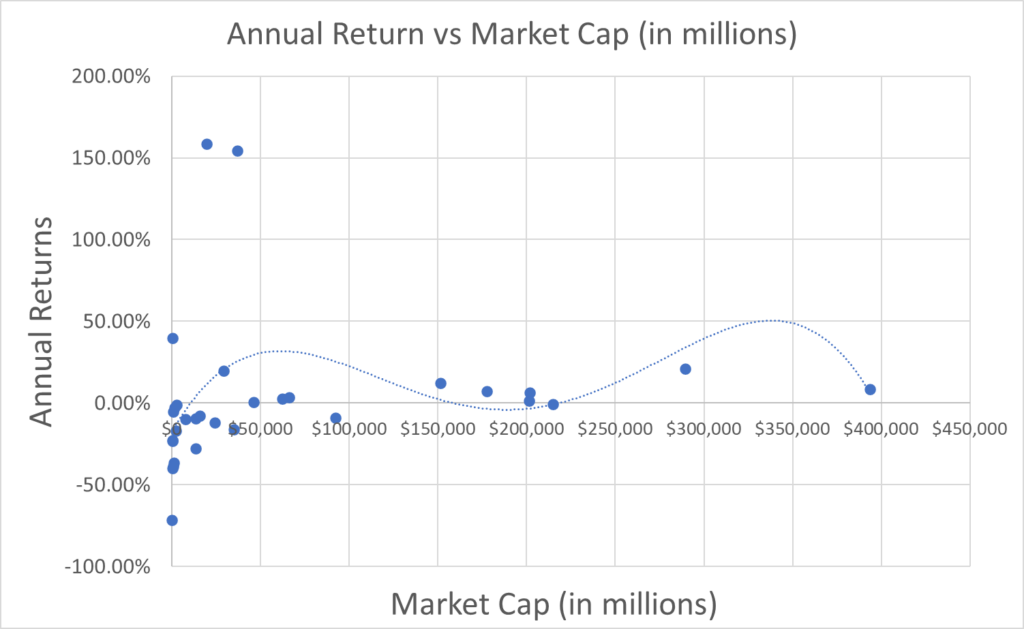
Figure 1
The following figures include data from 31 firms in healthcare across six sectors encompassing biotechnology, pharmaceuticals, healthcare providers & services, residential & commercial REITs, healthcare equipment and supplies, and food & drug retailers. The market capitalizations of the firms in the sample range from $21 million to $393 billion, while annual returns range from -71.60% to 158.67%.
Figure 1 consists of the annual returns over five years, or since IPO for companies who went within the last five years, versus the companies’ market caps, in millions. A market cap of $50,000 on the chart, for example, represents a company with a market cap of $50,000 million, or $50 billion. Additionally, the annual returns strictly reflect the appreciation in share price over the period, excluding dividends.
The chart portrays that companies with a lesser market cap have more variation in returns, with a few companies providing exceptional gains while most perform poorly. As market cap increases, however, annual returns become more stable, with the majority of these firms providing a yield of around 8-12% per annum. Consequently, the larger firms generally have more extensive and stable returns, while smaller firms have lesser, more erratic yields. Furthermore, most firms provide negative or relatively mediocre gains, while a few vastly outperform.
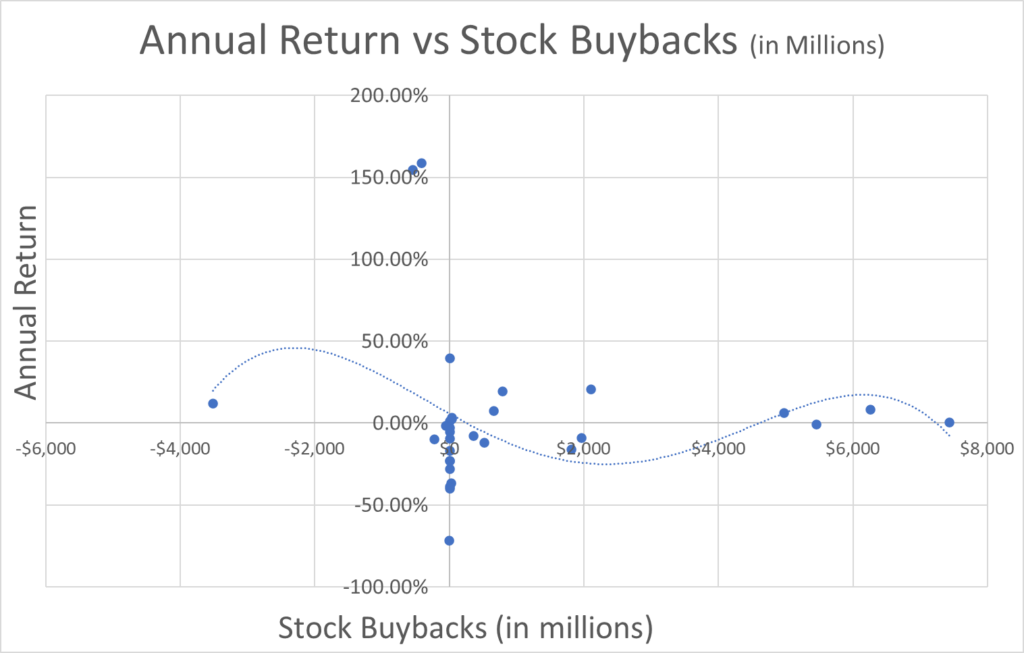
Figure 2
Figure 2 comprises annual returns versus stock buybacks over the last year, also known as trailing twelve months. Stock buybacks are also represented in millions, just as the market caps were previously, so $2,000 represents $2,000 million, or $2 billion of stock buybacks. Stock buybacks, also known as stock repurchases, decrease the total number of shares outstanding, thus increasing ownership of existing stockholders. Negative stock buybacks represent the issuance of shares or stock dilution. By issuing equity in the form of additional shares, the company can raise capital, but at the expense of existing shareholders, as their shares represent less ownership in the firm. The firm may then use this capital to fund its growth. In the sample, stock repurchases range from a low of -$3,520 million ($3.52 billion) to a high of $7,433 million ($7.43 billion).
The graph exemplifies the relationship between stock issuances and repurchases, as some companies that have issued shares have experienced high yields through their path to growth and expansion, while others yielded lackluster results. As stock buybacks increase, however, returns become increasingly stable. The companies with the most extensive repurchase programs have predominantly positive returns. Nevertheless, some firms with $2 billion in stock buybacks also have negative returns.

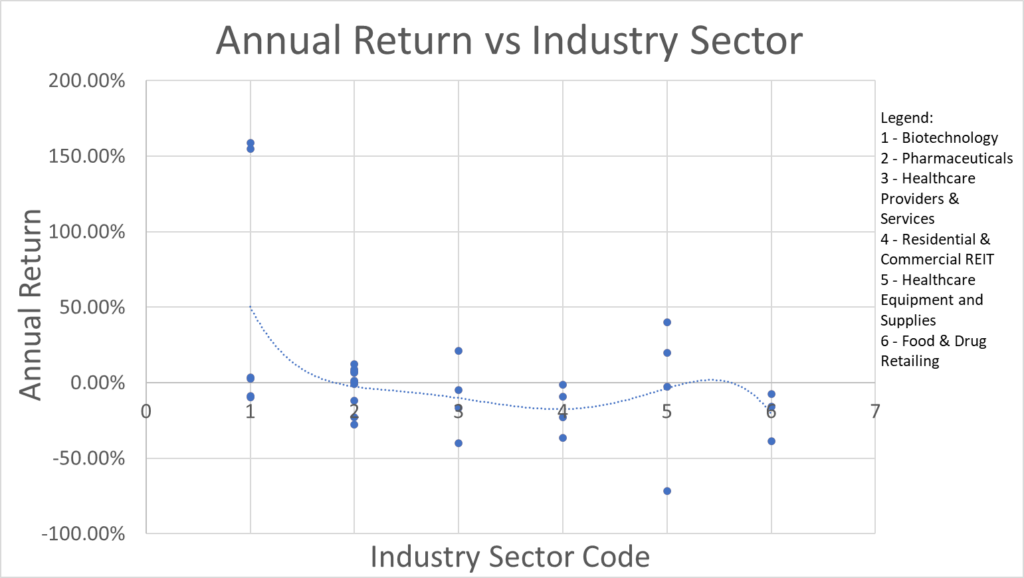
Figure 3
Figure 3 encompasses annual returns versus the industry sector, represented by a sector number. A legend for the sectors corresponding to their respective number is on the right side of the chart. Each point represents a company and its annual return within each sector. Some of the data points overlap, making them difficult to view, such as the biotechnology sector, in which there are six companies with two pairs of companies having nearly identical returns. The data used in the sample is included in the link below to view these companies with similar yields more effectively if desired.
The graph portrays the difference in returns across sectors and within sectors. Healthcare equipment and food supplies firms, for example, appear to outperform residential and commercial REITs, on average. Yet, within the healthcare equipment and supplies sector, there is a firm in the sample significantly underperforming the others. Similarly, in Biotechnology, two firms have experienced stellar returns, while others within the sector have experienced inferior yields. This difference is reasonable, as some firms and sectors become increasingly popular or experience periods of exceptional growth and profitability because of their strategic advantage through economics, despite other firms and sectors being out of favor or decreasingly profitable.


More Stories
2026: THE YEAR THAT PATIENCE PAYS OFF?
WHO WINS IF AGING IS DEAD?
WHY IS AI STRUGGLING TO DISCOVER NEW DRUGS?